RESTORE THE SHINE TO MEDALLION FINANCIAL CORP.

We’ve been invested in Medallion
for over 4 years

We’ve shared with Medallion
a 5 Step path to excellence

The SEC exposed corrupted leadership and bad governance
Medallion’s core business is down. They have had to borrow to pay dividends

Stockholders suffered as executives were paid tens of millions


WE CAN IMPROVE MEDALLION FINANCIAL CORP.
ZimCal Asset Management LLC and its affiliates (collectively “ZimCal”) are one of the LARGEST investors in Medallion Financial Corp. (“MFIN” or the “Company”).
In 2024, we ran an activist campaign to replace 2 board incumbents with our own candidates to make the board accountable to all stockholders rather than loyal to the Murstein family and management. MFIN and its President are currently under SEC investigation.
We prefer not to resort to activism but did so because we were appalled at the responses we received from MFIN to our questions about governance, leadership and performance. MFIN’s leaders are holding back the Company from achieving its tremendous potential.
MFIN insiders own 7 million shares and assuming they all voted, the Company started with a 44% vote lead based on 16 million shares voted. Despite adverse Glass Lewis and ISS recommendations, ZimCal still received 3.5 million votes or 21.8% of the 16 million in votes cast. Over 1 in 4 voted against the excessive management compensation¹⁴.
We will maintain this website to publish objective commentary on MFIN’s earnings and performance with clearly cited sources. Our goal is to hold management accountable and ensure proactive risk mitigation in an uncertain economic environment.

We are one of MFIN’s largest investors and hold both debt and equity. We have been invested for over 4 years.
Our detailed 5 Steps to Improvement plan outlines an effective path for MFIN to reach its potential.
MFIN is facing serious headwinds⁵ but it has tremendous potential. We believe that our 35-page 5 Steps to Improvement white paper provides a strong path forward. The white paper also includes MFIN’s detail-lacking objections to the plan¹³, likely driven by a desire to protect its COO and executives, so you can judge the inadequacy of their response for yourself.
Remove family control of the Board and add new directors with relevant banking, consumer lending, and capital markets experience that will answer to shareholders and hold management accountable. MORE
1
Remove the biggest obstacle to regaining credibility with investors and give shareholders the ability to quantify the financial impact of the lawsuit on their investment. MORE
2
Bring in a professional, slimmed down management team that has credibility with investors and can guide the company to long-term success. MORE
3
Reduce unnecessary expenses to increase profits to shareholders and to be better prepared for a possible economic slowdown and/or lower consumer demand. MORE
4
Get rid of distractions, improve the main consumer lending business and make technology a core focus so that MFIN can better compete in an ultra-competitive consumer lending environment. MORE
5
We have highlighted a few key drivers of our 5 Step plan below, focusing on the elements most pertinent to MFIN investors:
1. The SEC LAWSUIT is a very big deal, is frightening investors and will hold down the stock price. Even with a penalty, resolving it would instantly boost valuation.
THE BOARD HAS PROTECTED THE PRESIDENT OF MFIN, ANDREW MURSTEIN, RATHER THAN PROTECT STOCKHOLDERS WHO HAVE PAID AN ESTIMATED $8 MILLION¹² TO DEFEND HIM.
3 OF 8 BOARD DIRECTORS ARE MURSTEIN FAMILY MEMBERS.
The SEC alleges that Murstein lied on several occasions, committed fraud and violated various provisions of federal securities laws. See our proxy advisor presentation (pages 8-11) or 5 Steps (Section 2) for more details. On September 18th, 2024, a judge denied almost all of MFIN’s and Murstein’s motions to dismiss the charges concluding that the SEC’s complaint “contain[ed] more than sufficient allegations to support the claim that Murstein and Medallion Financial misled investors by withholding information material to Medallion Bank's fair value.”
MFIN’s credibility with investors is irreparably damaged, and based on the numerous FALSE allegations by MFIN against ZimCal, we believe very little of what MFIN says.


LATEST UPDATES AND PRESS RELEASES

2. MFIN’s core business is deteriorating.
To judge performance, we must analyze MFIN’s core business which will drive valuation. This represents 99.5% of assets and excludes the non-recurring impact of Taxi Medallions assets. Over the last 3 years, core performance has deteriorated materially¹⁰ and yet executive salaries and bonuses hit an all time high of $14.9 million in 2023⁹ which was 45% of core profit. Because Medallion Bank’s leverage ratio is at the FDIC-minimum, MFIN cannot earn enough to grow its balance sheet.
ROAA and Core ROAA
(Ex. Taxi Medallion impact)

Source: MFIN 10K/Q
FIGURE 1: Core ROAA, which removes distortion from non-recurring items, has declined in the last 3 years to a quarterly and cyclical low of 0.89% at 4Q23 and was 0.94% at 3Q24. This is worse than much lower risk, less volatile, better asset-quality commercial banks which usually target a ~1.00% ROA. Given the overall strength in the economy and resilience in consumer spending and confidence, this is concerning.
Net Income and Core Net Income
(Ex. Taxi Medallion impact)

Source: MFIN 10K/Q
FIGURE 2: Shows how significantly the Taxi Medallion loan recoveries (primarily) helped inflate profits in 2022 and 2023. Net profits were boosted by 43% over the 2 year period ($99 million reported, $69 million adjusted for Taxi Medallion impact). Core earnings have actually DECLINED every year since the peak in 2021. As expected, Taxi Medallion impact faded in 2024 and YTD earnings are down 37% over 3Q23.
Delinquency and Charge-off trends
(Ex. Taxi Medallion Impact)

Source: MFIN 10K/Q
FIGURE 3: Shows the deterioration in core consumer credit quality. This reflects all loan types excluding Taxi Medallion loans. Losses or Charge-offs (net) in 4Q23 and 1Q24 exceeded the recent cyclical high set in 4Q19 and are the highest in over 12 years, reflecting the concerns we shared with MFIN leadership in Oct 2023 based on our 2Q23 analysis. Recreation (~65% of the loan book) Charge-offs (net) are at their highest since 2010. 2Q and 3Q are seasonally low but are still at their highest compared to prior 2Qs and 3Qs. These charge-off trends mirror the same delinquency trends in FDIC consumer lending data¹¹ and could get worse before getting better.
MFIN CD rate changes compared to
average Treasury yields

Source: MFIN 10K/Q, FRED
FIGURE 4: Shows the lag upward and downward in Medallion Bank CDs compared to benchmarks. CDs were 88% of all MFIN’s interest paying liabilities at 3Q24. As CD rates go, so goes MFIN’s total cost of capital. Because MFIN’s CDs have a 1.7 weighted average life, they reset slower as rates move up but also reset slower as rates move down, as is clear from 2019 to 2023 (annual). They are also more closely tied to 1yr+ treasuries which have not moved down as much as the fed funds rate.
Core net income and provisioning (Ex. Taxi Medallion) versus unadjusted net income.

Source: Company 10K/Q
FIGURE 5: This shows the adjustments to reported earnings to remove the Taxi Medallion impact. Core net income (Ex. Taxi Medallion) has declined every year since the peak at FYE21. 1Q24 core net income was an anomalous improvement over 4Q23 core net income. While the 1Q24 headline core net income trend appeared positive, as our earnings commentary pointed out, 1Q24 core net income was boosted by irregular “gains on equity” and an inexplicably low core provision expense (Ex. Taxi Medallion). 2Q24 and 3Q24 core net earnings are essentially flat and hovering near all-time lows since MFIN became consistently profitable in 4Q20.
3. Medallion Financial Corp. stock has underperformed badly.⁴ For the 10 years through 09/30/24:
MFIN Stock down 30% in 10 years
Compensation Peer Group up 55% (median) in 10 Years³
Peer Group Commercial Bank Stocks up 72% in 10 years⁴
Russell 2000 Index up 102% in 10 years
MFIN stock price change vs. Peer Banks, Proxy Peers, KRE Regional Bank Index and Russell 2000 through 09/30/24

FIGURE 6: MFIN likes to use 3 year and 5 year “TSR” (Total Shareholder Return) to show gains in its stock price. This is very misleading because MFIN’s stock price is very volatile and because MFIN had a series of extraordinary events that significantly impacted its price over the last 5 years, including the SEC lawsuit and the implosion of its Taxi Medallion loan portfolio. For example, MFIN itself reported a 3-year TSR of 118.5% measured at 12/31/23 which dropped to 15.9% measured at 04/29/24. MFIN has shown mediocre YTD, 1 YR, 3YR and 10 YR returns and its 5 year return is after a 45% drop the 5 years prior. “Peer Commercial Banks” are all FDIC-insured publicly-traded banks between $1BN and $5BN in assets. Since 94% of MFIN’s FYE23 revenue was from Medallion Bank, we believe that banks are better stock comparisons. The proxy peer group includes MFIN AND all companies listed in MFIN’s DEF14A that were in existence as of the measurement period and are still publicly traded.
See HERE for graphs and other return data in the FAQ.
4. The board is family-controlled and is working for management rather than looking out for stockholders.⁹
MFIN’s Board has an average age of 74. There are 3 Murstein family members on the 8 person Board - Alvin Murstein (Chairman of the Board), Andrew Murstein (President) and David Rudnick (Andrew Murstein’s father-in-law). The average director’s tenure with either MFIN or Medallion Bank is 16.5 years. The current lead “independent” director has been on the boards of either MFIN or Medallion Bank for 21 years. We believe the Board’s actions show it is more loyal to the Mursteins (and management) than it is to stockholders.

For the 6 year period 2018 – 2023, after its conversion from a BDC, MFIN, a $2.6 billion asset consumer lender¹ had:
Cumulative net profits to stockholders - $77 million
Cumulative MFIN President’s pay - $25 million
Cumulative top 5 executives’ pay⁹ - $54 million
For the 6 year period 2018-2023, Synchrony Financial, a consistently profitable $117 billion asset consumer lender¹ had:
Cumulative net profits to stockholders - $17.4 BILLION
Cumulative Synchrony President’s pay - $55 million
Synchrony’s President only made $30 million more than MFIN’s President but generated $17.3 BILLION more in earnings for shareholders.
Over the 6 year period, MFIN distributed $36 million to its thousands of stockholders through dividends and share buybacks - which was only $11 million more than it paid one executive, its President Andrew Murstein, over the same period.
On top of this $25 million payday and despite the SEC charges stemming from his behavior, Murstein still continued to receive perks including paid country club and social club memberships, a driver, a car, car maintenance, and garage expenses.
See our FAQ for more details
5. Medallion Financial Corp.’s executive compensation is not tied to core performance, is excessive compared to peers and is unfair to stockholders.
In 2023, Andrew Murstein was paid 19% of MFIN’s ENTIRE core earnings to stockholders. The top 5 execs were paid 45% of ENTIRE core earnings. Since MFIN’s regulated bank subsidiary is 87% of MFIN’s assets and 94% of its revenues (FYE23), MFIN compensation should be judged and compared to other FDIC-regulated lenders, rather than the (mostly) specialty finance companies it is compared to currently by the Board.¹ However, we have compared MFIN to both (top banks and proxy peers), and in all cases MFIN’s executive compensation is massively excessive.
Comparison of MFIN compensation vs. Highly Capitalized Top Performing $50BN - $100BN Banks & $2BN - $5BN Peer Banks (FYE23 - most recent data for all comparable companies)

Source: S&P Capital IQ, DEF14A, 10K/Q. FYE23 is the most recent compensation data provided by ALL comparable companies.
FIGURE 7: Andrew Murstein, MFIN's President, was paid more in cash compensation than the highest paid executive of every comparison bank except Synchrony Financial. Comparison banks were chosen for their top performance metrics.¹ Synchrony Financial was included as a comparison because it is a large, consumer-focused FDIC-insured industrial bank. Compared to proxy peer companies, banks that are significantly larger/more complex, and banks that are similar in size but more consistently profitable, in almost every category Mr. Murstein was paid substantially more in cash compensation, total compensation, cash compensation as a % net income, cumulative 6 year compensation as a % of cumulative net income, and yet MFIN was underwhelming in CORE profits, returns, Price/TBV and asset quality compared to all of them.¹
Highest Paid Executive Cash Compensation (FYE23)
[Versus Proxy Compensation Peers]
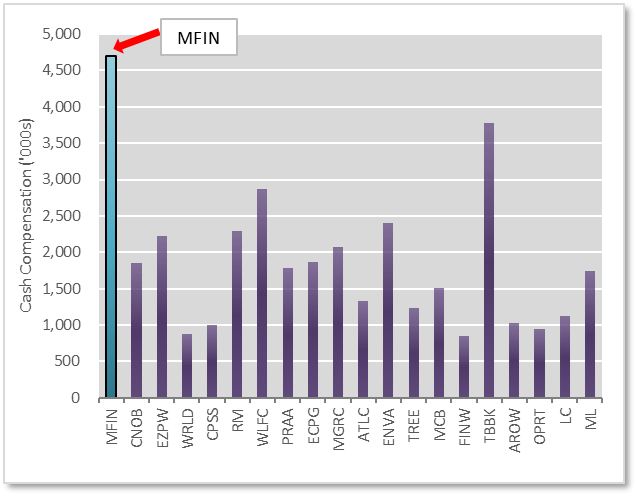
Source: S&P Capital IQ, DEF14A, 10K/Q
FIGURE 8: Andrew Murstein received the highest cash compensation in FYE23 versus the 19 public “compensation peers” that MFIN’s Board used to benchmark compensation in 2022-2024. This is despite core performance (Ex. Taxi Medallion) that was middle to bottom of the peer group (including ROAA, ROAE, Leverage, Tangible Book value).¹
Cum. Cash Compensation (2018-2023) as % Cum. Net Income (2018-2023) [Versus Proxy Compensation Peers]

Source: S&P Capital IQ, DEF14A, 10K/Q
FIGURE 9: Shows the cumulative CASH compensation paid to Andrew Murstein from 2018 - 2023 as a percentage of the cumulative reported net profits to stockholders versus compensation peers. He received $0.26 in cash pay for every $1.00 in profit to stockholders. It is clear that Mr. Murstein has been paid FAR more relative to the amount of profit he has generated. Compensation peers excluded 3 companies that had negative cumulative net income.
Cash Compensation as % Net Income (FYE23)
[Versus Proxy Compensation Peers]
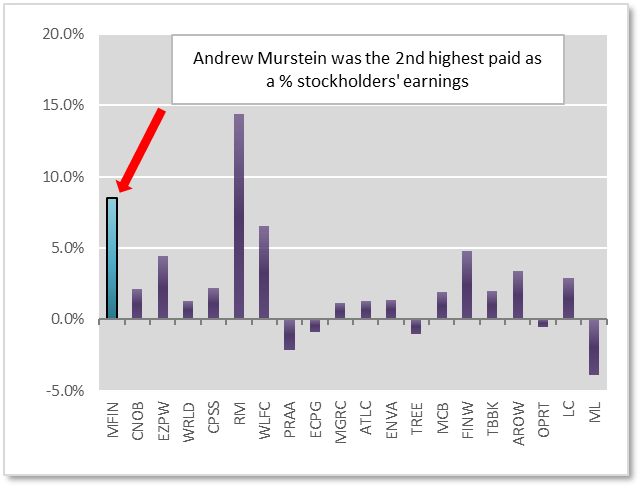
Source: S&P Capital IQ, DEF14A, 10K/Q
FIGURE 10: Shows the CASH compensation paid to Andrew Murstein in FYE23 as a percentage of profits generated for stockholders. Mr. Murstein was the 2nd highest paid in FYE23 and FYE22 at 3.9x and 3.4x the peer average. Murstein was also the highest paid in cash compensation as a percentage of revenue and operating expenses compared to proxy peers in 2023¹⁵. Murstein has consistently been near the top or at the top of these categories every year from 2021 - 2023.
6. Dividends could be suspended if core performance continues to worsen under the current management and Board. As predicted, despite “record” 2023 earnings, in 2024 MFIN’s Holding Company had to borrow money to buy-back shares and pay dividends.¹⁶
We know that consistent dividends are important to shareholders. When MFIN lost $76 million from 2017 to 2020, it suspended dividends. A thriving MFIN is critical to maintaining healthy dividend yields but based on weakening core trends¹⁰ and high holding company expenses, we warned that dividends could be threatened. Through 3Q24 MFIN had to borrow $10 million to cover $9.5 million in dividends and share buybacks. This is unsustainable¹⁶.
Dividend Yields

Source: S&P Capital IQ, 10K/Q
FIGURE 11: The dividend yield was calculated by summing the dividends paid each year and dividing by the average of the share price at the end of every quarter that year.
Interesting Stats
4.34%
MFIN’s annualized net charge-off rate for the Recreation loan portfolio at 1Q24. Recreation loans were 63% of Total Loans.
This was up over 800% in 2 years. and was the highest in over 12 years.
This equates to $58 million in annualized net charge-offs, which is equal to MFIN’s entire net profit at FYE23.
30x
The asset size difference between 2 top-performing FDIC-insured banks and MFIN.
The CEOs of the two ~$75 billion asset banks were paid $5.8 and $5.7 million in combined cash pay for FYE22 and FYE23. MFIN’s President was paid $8.3 million in cash pay.⁶
$0.70
The amount paid to MFIN’s top 5 executives from 2018 to 2023 for every $1.00 earned in net profit available to shareholders.
The top 5 executives were paid $54 million in total compensation while MFIN only earned $77 million for shareholders in the 6-year period.⁷
41%
The percentage of the $650 million in Taxi Medallion loans outstanding at FYE15 that were charged-off (net) from January 2016 through September 2024.⁸
About Us
ZimCal Asset Management is an alternative investment firm focused primarily on niche, illiquid and complex credit investment opportunities.
ZimCal is a co-founder and the manager of BIMIZCI Fund LLC which manages Warnke Investments LLC. All entities combined have a direct and beneficial interest in stock and debt issued by MFIN. ZimCal has been invested in MFIN for over 4 years.
ZimCal partners with both healthy and distressed borrowers or issuers, and provides customized solutions that meet their unique needs and circumstances. Over the last 15 years, Stephen Hodges, the Founder of ZimCal has developed a specialization investing in FDIC-insured institutions and has partnered with over 120 banks through investments in bank assets and bank debt and equity. Mr. Hodges has invested in bank debt, preferred equity and common equity. ZimCal has developed a deep network in the banking industry and fully understands the banking regulatory environment.
ZimCal usually works in collaboration with bank leadership teams if required, but on very rare occasions, must insert itself more forcefully if it believes that leadership is underwhelming and threatens to undermine ZimCal’s investments. ZimCal prides itself on performing extensive, rigorous financial analysis and research to fully understand the risks of any investment. Stephen Hodges founded ZimCal in 2015 after working for 12 years in banking and credit investing.
FAQ
Q1. Why did you challenge Medallion Financial Corp. (“MFIN” or the “Company”) through a proxy contest?
We are long-term investors that invested in MFIN over 4 years ago. After closely analyzing 2023 SEC filings by MFIN we detected several worrying trends and felt that MFIN was heading down the wrong path. We felt that there was a high probability of a substantial decline in the value of MFIN’s debt and equity if it didn’t make important changes to its governance approach and management team and focus on improving CORE⁹ business performance. We fundamentally believe that MFIN has a business that can thrive and create tremendous shareholder value in the long run if it is run the right way. If that happens, we plan on increasing our equity ownership over time.
Q2. Couldn’t you have privately tried to find a solution with MFIN?
That was our preferred approach. We first raised our concerns in October 2023 in a 28-page analysis we shared with management and the board. We provided supporting data and asked for feedback to correct anything inaccurate. That analysis forms the basis of our “5 Steps to Improvement”. After 2 months of fruitless conversations with MFIN, we told them that we were very concerned about the Company's future (1 to 5 years out) and that the only way we saw to implement change was via board representation through a proxy contest.…MORE UNDER “FAQ” PAGE.
Quotes to Ponder
Footnotes/Citations
1. Source: MFIN 2022 and 2023 DEF14A. S&P Capital IQ.
In its DEF14As, MFIN disclosed the peer group used in its Compensation calculations. Presumably this gives the Board some guidance on reasonable compensation and structure. This group changed slightly over 2022, 2023 and 2024 so ZimCal used ALL companies listed for all periods which came to 21 companies. 2 of the 21 were excluded. 1 was no longer publicly traded (ELVT) and the other went bankrupt (CURO). Proxy peers were in a variety of industries most not comparable to MFIN’s consumer lending focus or subject to FDIC regulation. To determine an “upper” compensation bound, MFIN was also compared to the top performing $50BN - $100BN asset banks with the strongest leverage ratios, highest ROAs (leverage ratio>9.50%,ROA>0.75%, Charge-offs (net) <0.50%) - this included Webster Financial and First Horizon with Synchrony Financial included because of its consumer focus. All the small and large banks were profitable every year over at least the preceding 6 years. MFIN was also compared to 3 of the top 10 performing $2BN - $5BN asset FDIC-insured banks (leverage ratio >13%, ROA>1% and Charge-offs(net) <0.10%) as of the analysis date - this included RBB Bancorp, Parke Bancorp and Baycom Bancorp. MFIN’s top executive compensation was compared to the equivalent at each company for each period. MFIN ranked poorly on several metrics when compared to the COMP proxy peer group alone at FYE23 (latest compensation data) including Market Cap (MFIN was 4th smallest), Leverage Ratio (8th worst), Compensation/Net Income (2nd highest paid), Cash Compensation/Operating Expenses (Highest paid/worst) and Cumulative Compensation/Total Net Profit (last 6 years) (highest paid/worst). The last 6 years were used because that is when MFIN transitioned from investment company accounting to bank holding company accounting and when MFIN acknowledged the full extent of the losses in their Taxi Medallion portfolio. MFIN ranked even worse against top performing large banks ($50BN to $100BN in assets) and top performing small, $2BN-$5BN banks as you can see from Figures 7 to 10. E.g. MFIN’s President was paid 8.5% of net income in cash compensation as % net income; the 3 largest top performing banks’ top executives were paid an average of 0.3%. The 3 peer banks were paid an average of 3.7%. There are numerous other examples. To compound this, comparable banks had high (relative) leverage ratios and yet at 3Q24, their P/TBV averaged 1.85x for the largest banks and 1.04x for the peer asset banks. MFIN was valued at 1.09x. MFIN’s charge-offs (credit risk), 4Q23 and 1Q23 ROAA and price volatility were all significantly worse than the bank comps (large or small) and yet Murstein is being rewarded significantly more than their highest paid executives.
Cash pay/non-cash pay ratio averaged 75% and 87% for the 2 highest paid executives at MFIN. This has averaged 86% going back to 2015. A higher proportion of stock-based or contingent compensation is typically associated with a better alignment with long-term shareholder interests.
Companies in the compensation peer group were in industries including: B2B equipment rentals; securitization; marketplace lending; unsecured revolving credit card lending; charge-off collections; or were sub-prime focused only. These are not good comparisons to MFIN. We believe that FDIC-insured institutions provide the best comparison to MFIN since the regulatory restrictions govern both the way it runs its business, its capital levels and dividend choices. Like MFIN, other FDIC-regulated banks also keep their loans on balance sheet.
2. Source: MFIN 10K/10Q
There are an abundance of metrics that show the rapid downward trend in the core consumer portfolios, we will show the most glaring. As of 3Q24 and analyzing trends after the peak at FYE21:
Asset Quality:
MFIN’s Recreation loan annualized charge-offs (net) increased 8.0x to 4.34% (1Q24) from 0.53% (4Q21). This is well above the previous cyclical high of 3.80% (4Q19) and could trend toward the GFC high of 5.99% (Annual 2009) but we hope not towards the Annualized quarterly high of 8.27% (1Q10). 2Q and 3Q are seasonal lows for charge-offs and yet 2Q24 and 3Q24 charge-offs are higher than the previous 2Q and 3Q peak in 2019.
Home Improvement loans annualized charge-offs (net) increased 7x to 2.11% (3Q24) from 0.30% (4Q21). This is more than 2.5x the previous cyclical high of 0.83% (4Q19). 2Q24 and 3Q24 are also above previous 2Q and 3Q highs.
We expect increases and decreases quarter to quarter (much like MFIN showed during the GFC) but the yearly trend we expect to get worse.
Period recoveries are also trending down as a % of charge-offs which could indicate a softening secondary market for Recreation collateral.
Capital Ratios:
MFIN’s consolidated leverage ratio declined to 12.6% at 3Q24. It was 15.3% at 4Q21.
Tangible leverage ratio only improved 1.1% to 7.1% at 3Q24 from 6.0% at 4Q21. This is despite record net income in 2022 and 2023. Such a thin tangible capital ratio leaves little room for error and MFIN has not focused on improving it.
Total (expensive) Holding Company indebtedness has increased to $179.5 million (3Q24) from $154 million (4Q21) DESPITE record earnings.
Earnings:
Yields on Recreation and Home Improvement loans have only gone up 40bps and 80bps respectively at 3Q24 since 4Q21, despite 3yr and 5yr treasuries up ~260bps. MFIN has been unable to pass on rate increases, even as its funding costs (mostly CDs) have ALSO increased over 250bps, resulting in a Net Interest squeeze which will continue to weigh on earnings at least through 1H25.
YoY reported Net Income declined 23% and 50% at 3Q24 and 2Q24 respectively. The difference was almost entirely the Taxi Medallion recoveries.
Reported Net Income was $55 million (FYE23) but was skewed by non-recurring, non-core Taxi Medallion asset recoveries – mostly loss provision reversals. These boosted net income by 67%.
Quarterly core ROAA has declined to 1.2% (3Q24) but after adjusting for the Taxi Medallion impact, it fell to 0.94%. This is the true ROAA on MFIN’s core business lines which is down from 4.8% at 4Q21.
On these, and several other ratios, the trends have been downward and concerning.
3. Source: MFIN DEF14A 2023, S&P Capital IQ
All 10 year returns computed 09/30/14 through 09/30/24.
In its DEF14A 2023, MFIN disclosed the peer group used in its Compensation calculations. Presumably this gives the Board some guidance on reasonable compensation and structure. This group changed over 2022 and 2023, so ZimCal used ALL companies listed as of 2023, 2022 and 2021 which came to 21 comparable companies, of which 1 is no longer public and another went bankrupt as of this analysis and so both were excluded from comparisons. Only 14 of the 20 companies (including MFIN) were publicly traded at 09/30/24 and 09/30/24. The stock price change in each period was calculated for each company that was public at the time and the median return was used. The average is significantly higher.
We believe the Peer comparisons are cherry-picked and inadequate since the companies bear little resemblance to MFIN. However, we included them here for comparison. Reasonable comparisons should consider:
a) Since the Company is at its core a lender dependent almost entirely on spread income rather than fee income, benchmarks should also be primarily lending institutions rather than fee generating business models (e.g. not origination to securitization/sale, or B2B equipment rentals, marketplace platforms, or pawn shop lenders);
b) Since the company has considerable prime exposure in its dominant portfolio and business segments, benchmarks should also have the same prime/sub-prime composition with loans secured by consumer discretionary/real assets (e.g. not unsecured credit cards, or charge-off collections, or only sub-prime focused);
c) Since the Company’s main and only profitable subsidiary is an Utah DFI/FDIC-insured bank with regulators setting strict rules against excessive leverage, limiting up-streamed dividends to the HoldCo and who can approve/disapprove of new business lines, benchmarks institutions should also be mostly FDIC-insured;
d) Benchmarks should be comparable in size (market cap, revenues etc.) to the Company and employ similar leverage with similar risk profiles and earnings volatility.
We believe that FDIC-insured institutions provide the best comparison to MFIN since the regulatory restrictions govern both the way it runs its business, its capital levels and dividend choices. Like MFIN, other FDIC-regulated banks also keep their loans on balance sheet.
4. Source: S&P Capital IQ
All 10 year stock price changes computed 09/30/14 through 09/30/24. Publicly traded peers included 205 publicly traded bank stocks with $1 billion to $5 billion in assets as of FYE23.
5. MFIN 10K/Q, ZimCal estimates, experience and industry research.
As do all consumer lenders, given the higher for longer interest rates and reversion to historical charge-offs. MFIN specifically is facing a confluence of headwinds, including higher for longer rates pressuring borrowers, large Recreation sub-prime exposure (20% of total assets), demand cyclicality in the Company’s 2 main lines of business (Recreation and Home Improvement lending), and more expensive funding costs. These are just a few of the near-term material risks that could result in lowered profits or losses for MFIN.
6. Source: S&P Capital IQ, MFIN DEF14A
Comparison banks were those with $50BN-$100BN in assets that were best capitalized with the highest leverage ratios (>9.5%), an ROE > 0.75% (closest to MFIN’s ratios) but with a much lower charge-off ratio than MFIN (<0.50%). We reasoned that because they were the top performing, large banks with consistent returns and outperforming MFIN, their top executive compensation would be significantly higher than the compensation of Andrew Murstein. We were very, very wrong.
7. Source: S&P Capital IQ, MFIN MFIN DEF14A
This excludes non-cash compensation which is often in stock or options with or without restrictions. Stock-based compensation is typically thought to better align the incentives of employees or management with shareholders. Adding in the value of non-cash compensation makes this number even worse. It increases to $1.57.
8. Source: MFIN 10K/Qs 2014 through 2023
Taxi Medallion charge-offs (net) were calculated by adding all Taxi Medallion loan “net realized losses” (in BDC accounting terms) held at the Holding Company with all Taxi Medallion loan charge-offs (net) at the Medallion Bank subsidiary through 1Q18 when MFIN converted to Holding Company accounting from BDC accounting. At the BDC to Holding Company conversion at 1Q18, unrealized losses in the entire loan book were converted to realized losses, as the NET loan balance was reflected in the 2Q18 financial statements. As a result, ZimCal estimated 2018 charge-offs by combining realized losses and “unrealized depreciation balance” at 1Q18 with charge-offs (net) at 1Q18 (at the Bank only), and added these to charge-offs (net) on a consolidated basis from 2Q18 through FYE18. This totaled $72 million for the year. Taxi Medallion net realized losses totaled $146.9 million through 1Q18 and $123 million from 2Q18 through 3Q24 for $267 million in cumulative charge-offs (net).
9. Source: MFIN DEF 14A, MFIN 10K/Qs 2018-2023, S&P Capital IQ
Most recent year of compensation data available for all comparable companies is FYE23. We have calculated annual and cumulative total cash and non-cash (non-cash, deferred or contingent) compensation of the top 5 highest paid executives (including Andrew Murstein) for the respective period. The data show that relative to net earnings generated for shareholders, management pay over the last 6 years has been in excess of earnings to shareholders particularly in the context of company performance relative to peers and absolutely.
Cash pay/non-cash pay ratio averaged 72% and 87% for the 2 highest paid executives. This has averaged 86% going back to 2015. A higher proportion of stock-based or contingent compensation is typically associated with a better alignment with long-term shareholder interests.
When compared to much larger, top performing institutions $50 billion to $100 billion in assets, top performing peer banks with $2 billion to $5 billion in assets, the Compensation proxy peer group AND given the downward trending performance metrics noted above, we simply cannot understand how cash and total compensation were at their highest levels ever and higher both relatively and absolutely compared to the reference groups cited above. See Footnote 1. above for more details.
10. Core performance is the most critical metric to track for any company. Core performance refers to MFIN’s primary revenue generating and ongoing core businesses which does NOT include Taxi Medallion assets. Core business lines are business lines and associated services which represent material and recurring sources of revenue, profit or franchise value for an institution or for a group of which an institution forms part. These future cash flows are what will determine the value placed on the enterprise by investors. ZimCal elected to remove Taxi Medallion assets from core performance when they dropped to less than 5% (net) of total assets, which occurred at FYE20.
Taxi medallion adjustments consist of taking net income then subtracting Taxi Medallion specific provision reversals, adding repossessed Taxi Medallion collateral write-downs, subtracting gains on sales of foreclosed Taxi Medallions and adding (reversing) the tax impact of the adjustments. At the pre-tax operating income level, the impact of taxes is not relevant. At FYE23, MFIN included $7.3 million in expenses in its Medallion Segment results ostensibly for managing the remaining $13.7 million in gross Taxi Medallion assets. We believe that expense is ludicrous and inaccurate, especially given that total servicing costs for the $2.1 billion consumer portfolio were $9.5 million (FYE23). Therefore, we do not add those Taxi Medallion expenses back when computing income excluding the Taxi Medallion impact.
11. Source: FDIC Quarterly Banking Report 4Q23.
Trends were tracked in consumer individual loans, consumer credit cards and consumer auto loans. Consumer charge-offs (net) exceeded the pre-pandemic high at 4Q19 for the first time for credit cards (4.15% at 4Q23 vs. 3.75% at 4Q19), loans to individuals (1.31% vs. 1.01%) while auto was exceeded in 3Q23 (0.98% vs 0.94%). These trends track $2.1 trillion in loans outstanding so the data is representative.
12. Source: MFIN 10K/Qs.
Professional fees contain the SEC-related legal fees and these totaled $18.9 million in 2022 and 2023. These are significantly above historical averages, and we attributed $7 million of the excess to the SEC affair and an additional $1 million YTD 3Q24. ZimCal has asked MFIN repeatedly for a breakdown of legal fees as well as the amount and use of Directors and Officers insurance coverage but has been denied.
13. Source: Medallion Financial Corp. Investor Presentation May 2024 and multiple shareholder letters send between April and June 2024
14. Source: MFIN 2024 DEF14A filings
Stockholder vote count and results can be found on the SEC website here.
15. Source: S&P Capital IQ, MFIN DEF14A
Compared to the 19 proxy peers who provided data for 2023, Andrew Murstein’s cash compensation as a percentage of total revenue was 1.8% (highest/worst), with a peer median of 0.4%. Cash compensation to total SG&A was 6.3% (highest) with a median of 0.9%. Cash compensation to net income was 8.5% (2nd highest), with a peer median of 1.9%. Rankings are almost identical for total compensation percentages (cash + stock or contingent pay). Murstein has been at or near the top of these categories every year over the last 3 years (2021 - 2024).
16. Source: MFIN 10K/Qs.
Since 2022, MFIN has funded Holding Company shortfalls by issuing expensive debt with HoldCo debt increasing to $179.5MM at 3Q24 from $169.5MM at 1Q24 and $154MM at 4Q22. MFIN funds HoldCo operating expenses (which includes Murstein’s substantial salary) and dividends to stockholders mostly through upstreamed dividends and has relied on Medallion Bank remaining sufficiently profitable and able to pay dividends while borrowing the shortfall. For context, as of FYE23, estimated Holding Company debt service will be ~$14 million over the next 12 months and HoldCo operating expenses were ~$20 million in 2023. This means that the Bank must be sufficiently profitable to upstream ~$25-$30 million in 2024 to cover expenses and debt service and this is after paying any Bank preferred equity dividends ($6 million in 2023). The Bank has only made an annual profit greater than $30 million 3 times in the last 10 years, in 2021-2023, which was during unprecedented fiscal and monetary stimulus and with the aforementioned non-recurring and non-core Taxi Medallion recoveries. Importantly, although the Bank is currently compliant with the 2003 FDIC capital maintenance agreement entered into by the Bank that mandates a minimum 15% Tier 1 Leverage ratio, that could change if asset quality deteriorates. FDIC-insured institutions can also have additional distribution restrictions placed on them by regulators that are typically tied to profitability and asset quality, regardless of the Leverage ratio. If future asset quality issues exceed expectations and credit loss reserves, and/or a sustained period of higher funding costs lowers NIM, the 1% margin above the 15% minimum would disappear instantly, impacting dividends available to the Holding Company, possibly in the midst of a highly uncertain and risk-averse capital raising environment.